- CompressConvertAI PDF
- Organize
- View & Edit
- Convert from PDF
- Convert to PDF
- SignMoreScan
- Home
- ›
- ›How to Copy Graphs & Charts from PDF (3 Easy Methods)
How to Copy Graphs & Charts from PDF (3 Easy Methods)
Copy graphs and charts from any PDF into Word using screenshots, direct copy, and AI-powered extraction. Everything stays sharp and readable.
AI Tools & Guides
More on Edit PDF
More on Excel to PDF
If you have ever tried to grab a chart from a PDF and drop it into Word, you know it can get messy. Some PDFs lock content, others blur the graph, and sometimes Word refuses to paste it the way you want.
We will walk you through practical ways to copy graphs from a PDF to Word, plus show you how to use Smallpdf AI when you need both the chart and the data behind it.
Quick Ways To Copy A Graph From PDF To Word
Method 1: Copy Graphs From PDF To Word With Smallpdf AI
When you work with long reports, financial statements, or research PDFs, Smallpdf AI gives you more than a flat picture. You can locate specific charts, copy them, and, when available, extract the data that powers them.
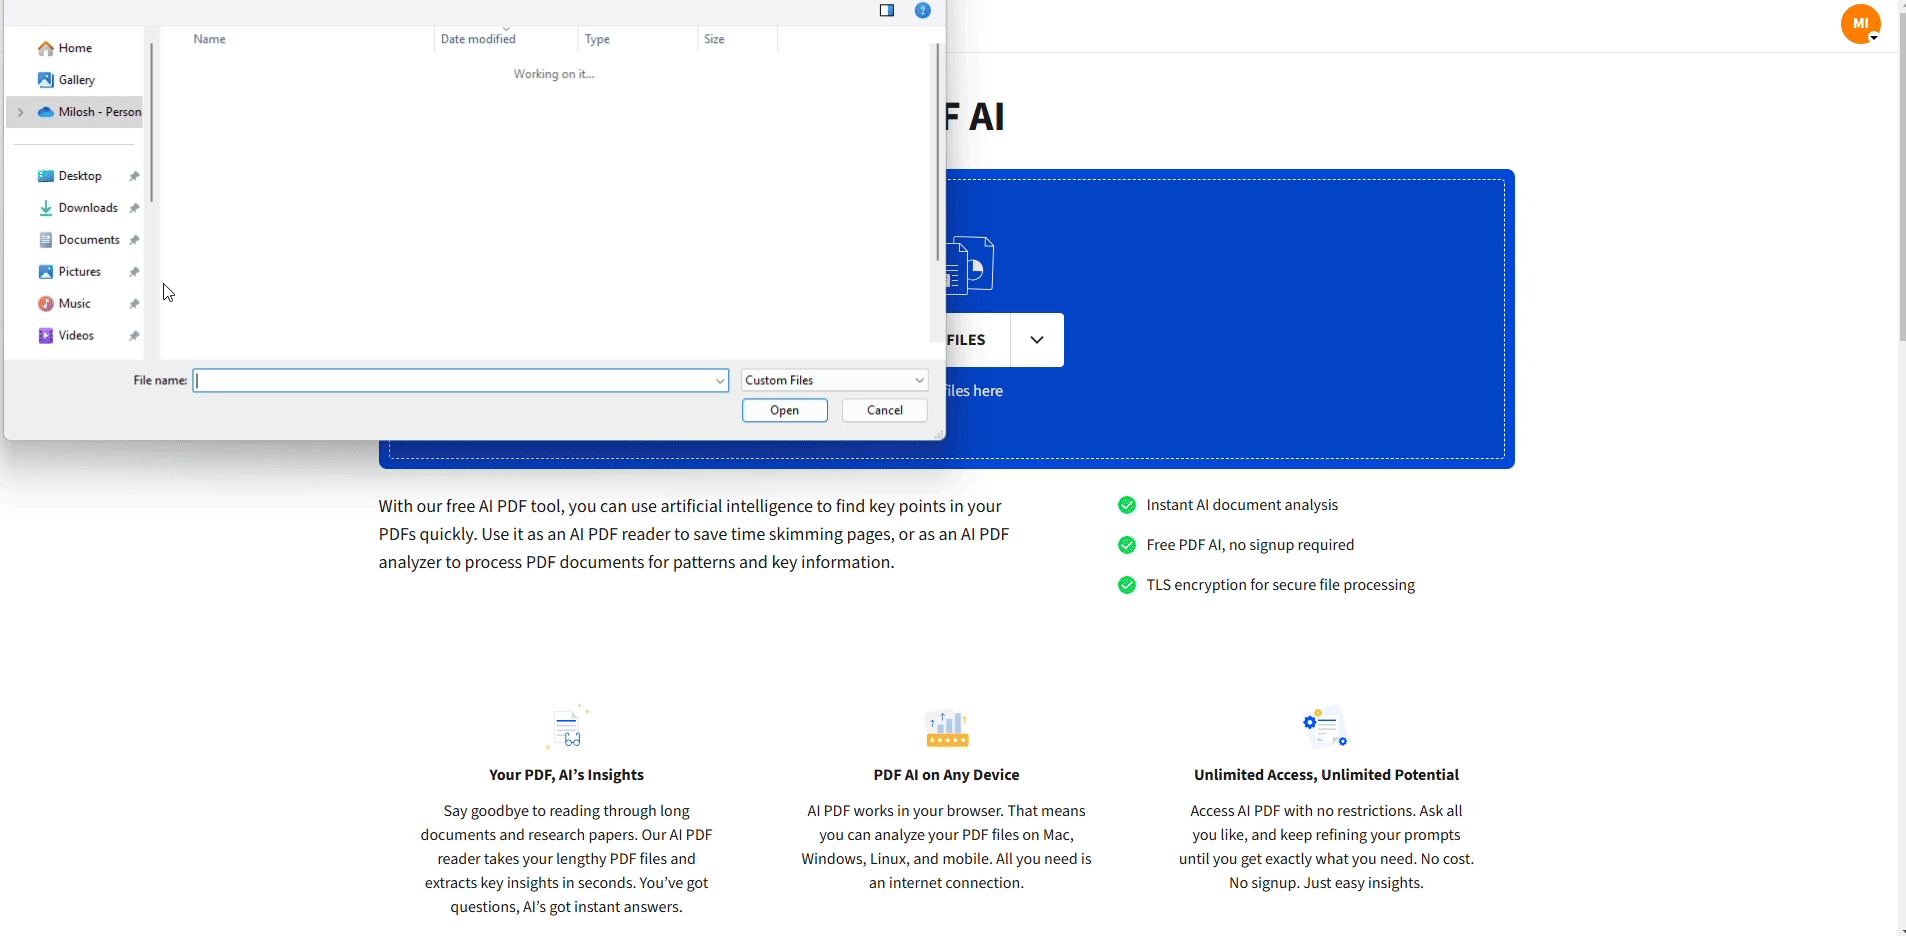
Step 1: Upload Your PDF To AI PDF
Open the AI PDF on Smallpdf.
Drag and drop your PDF into the drag-and-drop area below, or click to upload from your device, Google Drive, Dropbox, or OneDrive.
3. Wait a moment while we process the file in your browser. There is nothing to install.
Step 2: Let AI Find The Right Chart
Once uploaded, AI PDF scans your document and understands both text and visuals.
You can then ask:
“Show me the sales growth chart.”
“Find the revenue graph in section 3.”
“Where is the bar chart comparing regions?”
The AI highlights the relevant area and brings the chart into focus, which saves a lot of scrolling in large PDFs.
Scenario example: You receive a 60-page quarterly report and only need the three key charts for your slide deck. Instead of scanning every page, upload it to AI PDF, ask for “main performance graphs,” and jump straight to them.
Step 3: Copy The Graph And Paste It Into Word
When the chart is on screen:
Use the copy option next to the AI response or within the preview to capture the graph.
Open your Word document.
Paste with “Ctrl + V” (Windows) or “Cmd + V” (Mac).
You now have a clean chart in Word, ready to resize and position.
Step 4: Extract The Data Behind The Chart (Optional)
For some charts, AI PDF can also reconstruct the underlying dataset:
Ask: “Give me the data behind this chart in table form.”
Copy the resulting numbers into Excel or into a Word table.
This is especially useful when you want to redesign the graph using Word or PowerPoint’s built-in chart tools while staying faithful to the original data.
Method 2: Copy Graphs Using The Select Tool In Your PDF Viewer
If your PDF is not locked down and the chart is not just a scanned image, you can often copy it directly.
Step 1: Select The Chart In Your Viewer
Open the PDF in your browser or a desktop PDF viewer.
Switch to the “Select” or “Select Image” cursor (usually a standard arrow).
Click the graph or click-and-drag around it to highlight the area.
Step 2: Copy And Paste Into Word
Right-click the selected graph and choose “Copy” or “Copy image.”
Open your Word document.
Use “Paste” or “Paste Special:”
Regular “Paste” works for most cases.
“Paste Special” > “Picture (Enhanced Metafile)” often keeps vector-level sharpness for better scaling.
Once pasted, you can resize, position, and format the chart inside Word.
When The Select Method Works Best
Use this approach when:
The PDF is exported directly from Word, PowerPoint, or similar apps.
The chart looks crisp even when you zoom in.
The document does not block copying in its security settings.
If the graph cannot be selected or gets pasted as a blurry image, switch to screenshots or AI extraction.
Method 3: Take A Screenshot Of The Graph (Windows & Mac)
Screenshots are ideal when you need a quick result and do not mind a raster image.
Screenshot On Windows
Open the PDF and zoom in so the chart fills most of the screen.
Press “Windows + Shift + S” to open the snipping overlay.
Select “Rectangular Snip.”
Drag around the graph to capture it.
The snippet is copied to your clipboard; open Word and press “Ctrl + V.”
If you prefer, paste into an image editor first, save as “PNG,” and then insert into Word.
Screenshot On Mac
Open the PDF and zoom into the chart.
Press “Cmd + Shift + 4” to enable a selection crosshair.
Drag around the chart to capture it.
The screenshot saves to your desktop by default, or you can add “Ctrl” to copy directly to the clipboard and paste into Word.
Quality tip: The more you zoom in before taking the screenshot, the cleaner the chart will look in Word.
How To Paste PDF Graphs Cleanly Into Word
After you copy the chart, the paste step determines how it behaves inside your document.
1. Use Paste Special For Better Quality
In Word:
Place your cursor where you want the chart.
Go to Home > “Paste” > “Paste Special.”
Choose one of:
Picture (Enhanced Metafile) for sharp, scalable graphics.
Picture (PNG) for screenshots and raster images.
Enhanced Metafile often keeps line sharpness and smoother scaling, which is perfect for slides, reports, and print.
2. Format Charts After Pasting
Once the graph is placed:
Right-click and choose “Format Picture.”
Adjust size so labels remain readable.
Align the chart with the surrounding text or place it inside a layout grid.
Use “Wrap Text” options like “Square” or “Tight” to move it easily around paragraphs.
This helps your imported graphs feel like a natural part of the document rather than an awkward add-on.
Best Practices to Keep Your Graphs Sharp
Not all charts are simple bar graphs. Some are dense dashboards, multi-axis plots, or complex infographics.
1. Understand Vector vs Raster
Vector-style charts (often coming from PowerPoint or Illustrator) scale cleanly and stay sharp.
Raster images (like screenshots or scanned pages) have fixed resolution and blur when enlarged.
Whenever possible:
Use AI extraction or direct copy to keep vector-like quality.
Avoid scaling raster screenshots beyond their original size.
2. Choose The Right Image Format
For most Word documents:
PNG: Best for charts, diagrams, and anything with text and lines.
JPG: OK for photo-heavy visuals but not ideal for line graphs.
If you plan to export your Word file to print:
Test print one page with your chart to check sharpness.
Adjust your capture method (AI extraction vs screenshot) if lines or labels look soft.
Troubleshooting: Common Issues Copying Graphs Into Word
Even with the right method, you might run into small problems. Here is how to fix them.
1. The Graph Pasts Blurry Or Pixelated
Possible causes:
You used a low-zoom screenshot.
Word downscaled the image.
Fixes:
Zoom in further on the PDF before capturing.
Use Smallpdf AI or the Select method instead of screenshots.
After pasting, right-click the image, choose “Size and Position,” and avoid stretching it too far beyond its original size.
2. You Cannot Select The Graph In The PDF
Possible causes:
The PDF is a scanned image.
Copying is blocked by the document’s permissions.
Fixes:
Try the screenshot method (Method 3).
Use AI PDF to locate the page, then capture or extract what you need.
If it is a secured professional document, ask the owner for a copy with copying allowed.
3. Word Keeps Changing The Layout When You Paste
When you paste charts, the surrounding text can jump around.
Fixes:
After pasting, select the chart and choose “Wrap Text” > “Square” or “Tight.”
Use “In Front of Text” if you want full control over placement.
Insert the chart inside a table cell or content control to keep it anchored.
You Only Have A Picture But Need The Data
If you want to recreate the chart in Word or Excel:
Upload the PDF to AI PDF.
Ask for the data behind the chart in table form.
Copy that table into Excel or into a Word table and rebuild the chart with Office’s chart features.
This works well for financial charts, performance dashboards, and research plots.
Why Use Smallpdf For Copying Graphs & Charts To Word
We built Smallpdf so you can move comfortably between PDFs and editable documents without heavy software.
With our features, you can:
Use AI PDF to locate and copy charts from long reports.
Extract data behind graphs, not just the picture.
Convert entire pages with PDF to JPG when you need a layout-based image.
Keep everything in your browser, on any device, without installing extra apps.
No matter if you are preparing a client report, a pitch deck, or a research summary, you can move from static PDF charts to clean Word visuals in just a few steps.
Want to Copy Charts from PDF for Free?
Frequently Asked Questions
Can I copy graphs embedded as images in a PDF?
Yes! Smallpdf AI PDF identifies and converts both text and images, so you can easily copy a graph even if it’s embedded as an image.How do I copy a graph from PDF to Word?
Use “Paste Special” after copying and choose “Enhanced Metafile” for the best quality. This preserves vector graphics and keeps your charts crisp.How do I copy a graph from PDF to Excel?
Excel can only accept graphs as images—it can’t reverse-engineer the original chart. For the underlying data, use Smallpdf AI's PDF data extraction feature instead.Why does my copied graph look blurry?
Screenshots capture the screen resolution, which can look pixelated when enlarged. For better quality, use Smallpdf AI PDF.Can I copy graphs from password-protected PDFs?
If you can view the PDF, you can usually copy from it. Owner passwords prevent editing, but permissions passwords might block copying—you’ll need the password first.What’s the best format to save copied graphs?
Use SVG for vector graphics (charts, diagrams) and PNG for raster images (photos, complex visuals). Both maintain quality better than JPG.Convert PDF graphs and charts into usable formats with Smallpdf Pro
Related Articles