The Screen Stack of the Successful
New Smallpdf research shows the top 25% of professionals win by adopting newer tools faster and losing less time to file hassles.
Smallpdf surveyed 1,011 working professionals about the devices, tools, and file habits behind their workday to find out what sets top workers apart. High performers in this study held a manager or senior leadership role, earned a promotion or a significant raise in the past 2 years, and rated their own performance as above average or in the top 10%. They stand out not for tidier desks or harder work, but for adopting newer tools faster and losing far less time dealing with files.
Key takeaways
High performers run a bigger stack, using 3.4 devices in a typical day and 7 active tools a week, compared to 2.9 devices and 6 tools for everyone else.
The phone beats the laptop, with 77% of high performers working off a smartphone, just ahead of the 75% on a laptop.
Only 17% of high performers run mostly Apple devices, while 63% use Windows and Android.
29% of high performers admit their setup looks chaotic but works for them, nearly matching the 30% of everyone else.
High performers run Perplexity and Meta AI roughly twice as often as the general workforce, and Claude 1.5 times as often.
The average worker loses 65 hours a year to file and document hassles, the equivalent of 8 full workdays.
High Performer Tools and Habits
The top 25% of professionals lean on artificial intelligence and cloud tools.
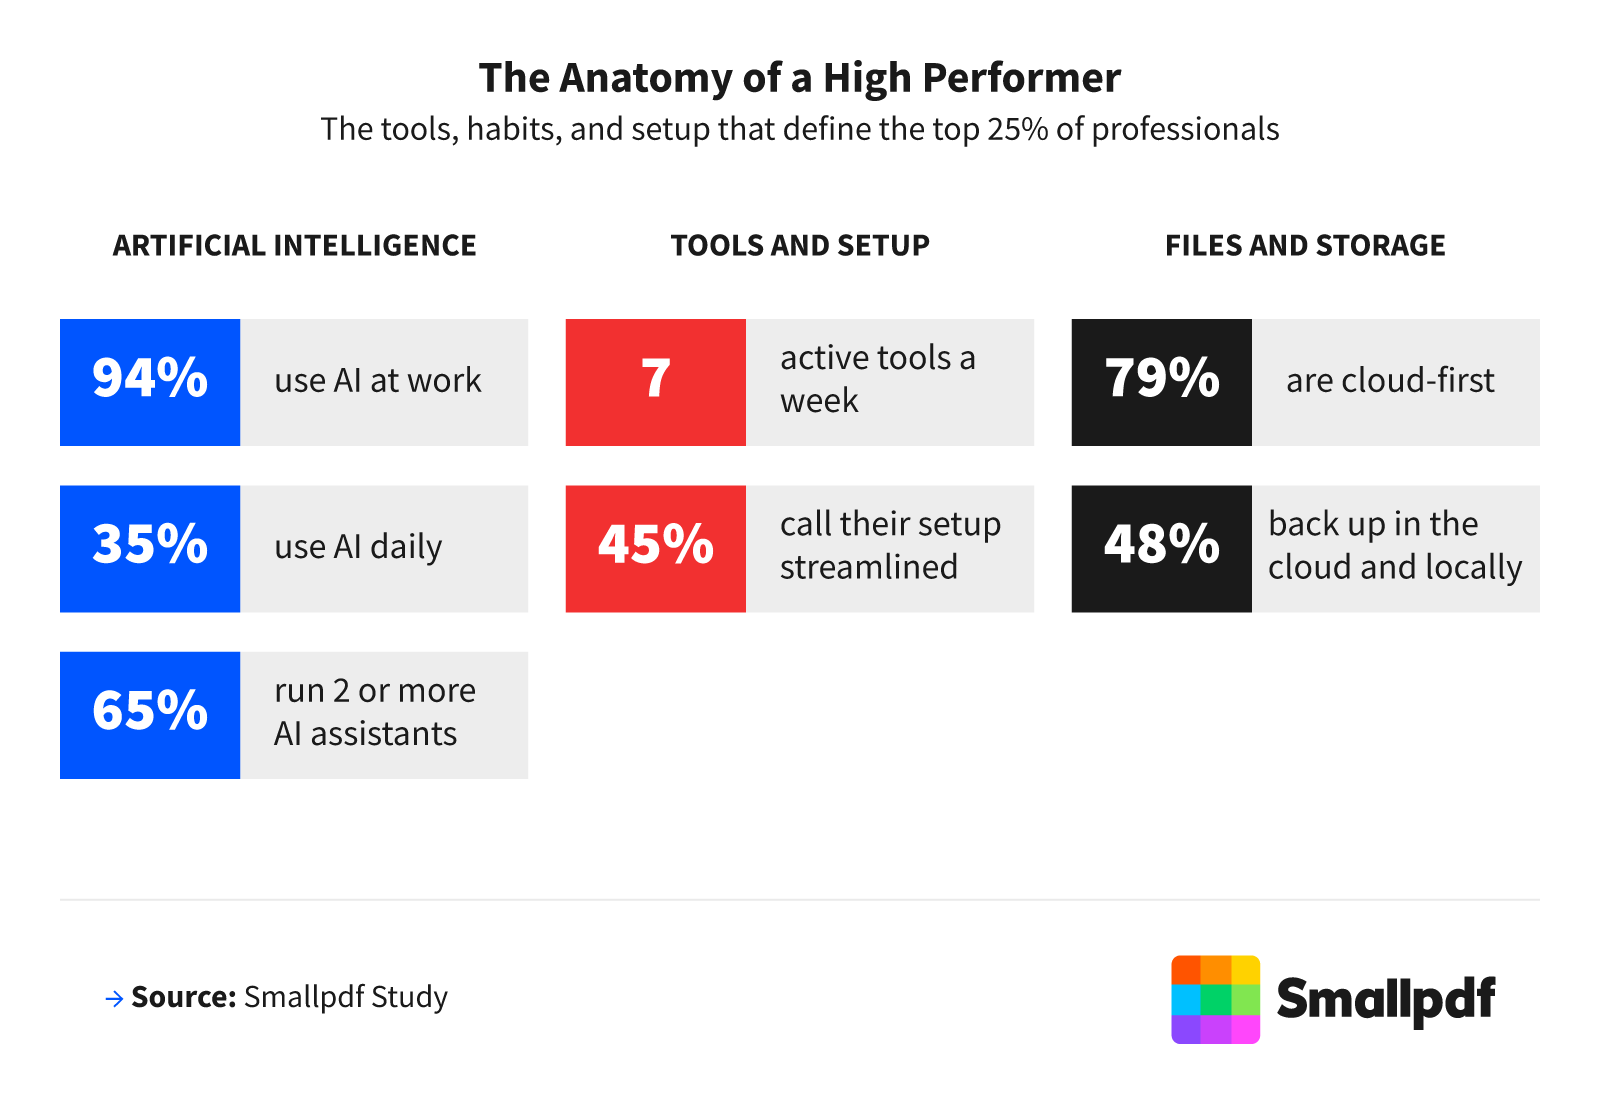
AI is now standard equipment for high performers. Ninety-four percent said they use AI at work, and 35% use it every day. Daily AI use increased by seniority, from 19% among individual contributors to 32% among managers to 47% among senior leaders. Two-thirds of high performers (65%) ran 2 or more AI assistants at once.
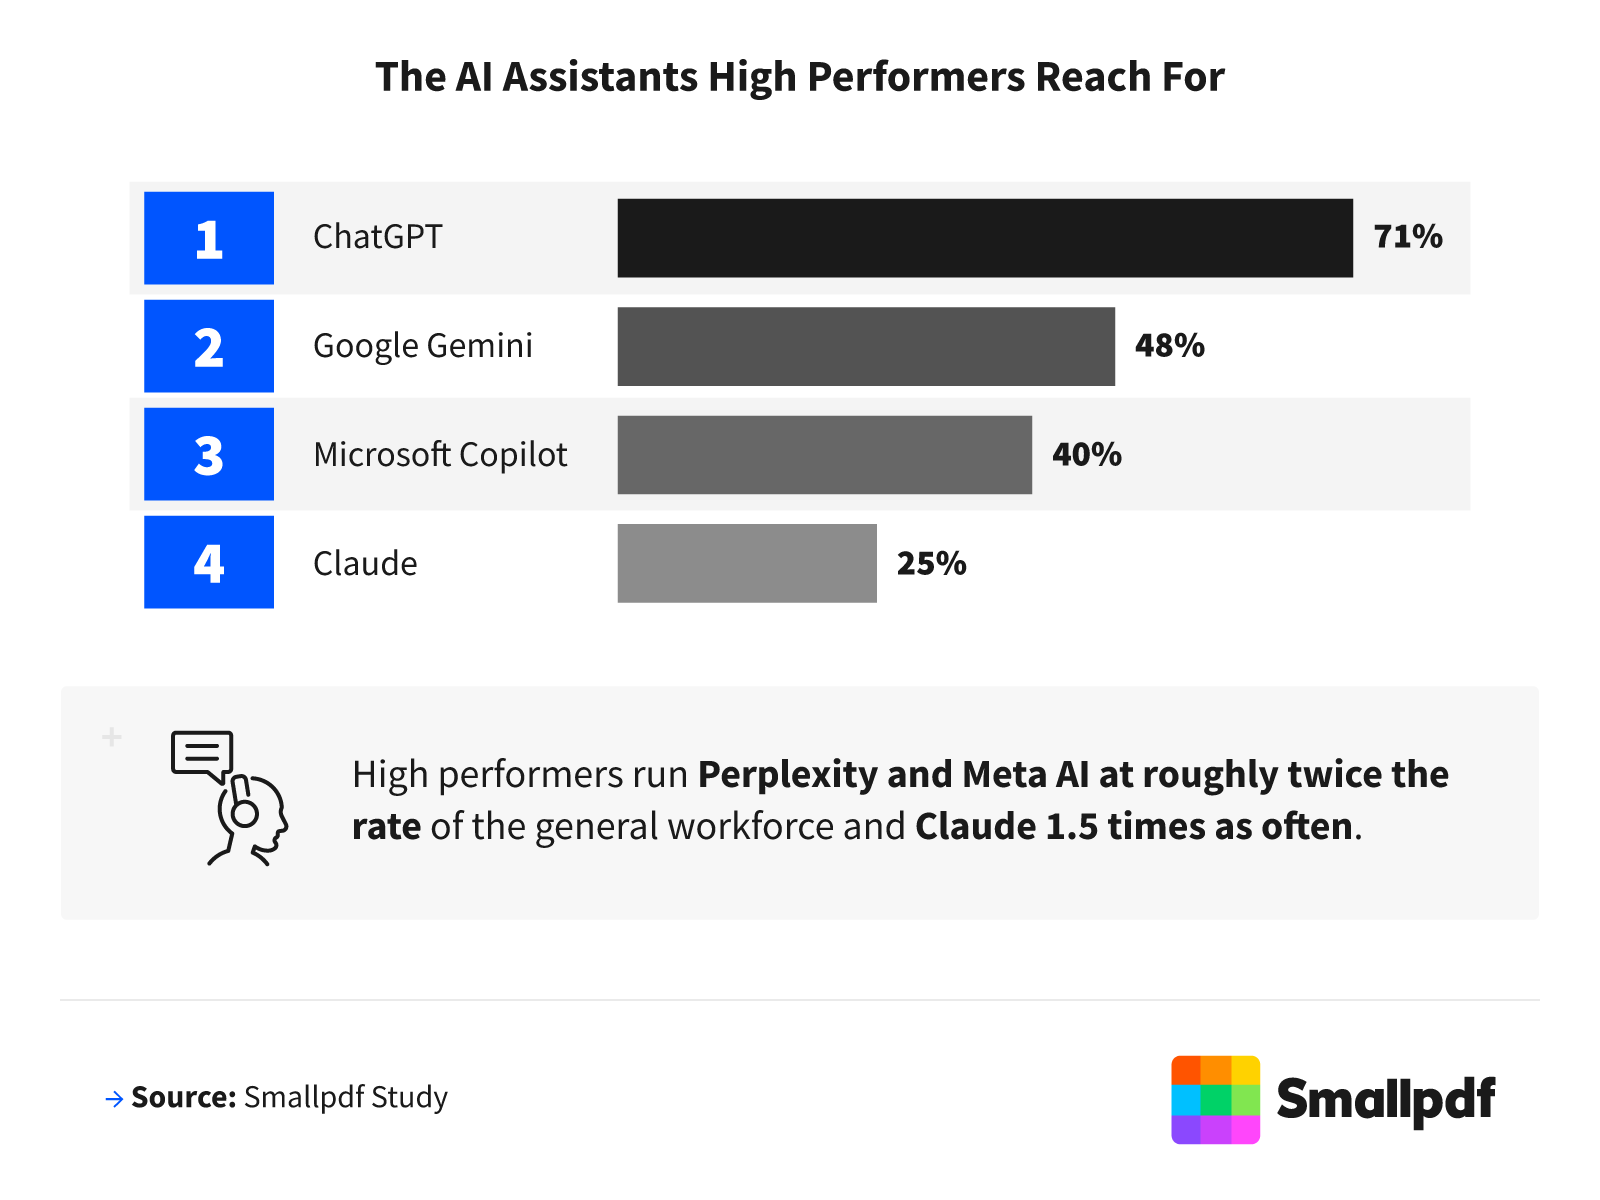
ChatGPT is the AI assistant high performers reach for most often (71%), followed by Google Gemini (48%), Microsoft Copilot (40%), and Claude (25%). The bigger tell was their appetite for newer tools. Compared to the general workforce, high performers were:
2.3 times as likely to use Perplexity
2.2 times as likely to use Meta AI
1.5 times as likely to use Claude
Beyond AI, the best performers ran about 7 active tools per week, compared to everyone else's 6. They also worked across an external monitor more often (57% vs. 49%).
Speed from AI clearly helps, but the workers pulling ahead pair it with dependable file habits rather than trusting automation to catch every mistake. Among high performers, 79% were cloud-first, keeping their work in cloud storage rather than on a local hard drive, compared with 64% of the general workforce.
Nearly half of high performers (48%) kept copies in both places. Whether that habit sharpens their work or simply comes with the collaborative, multi-device roles they tend to hold, a cloud-first setup is one of the clearest lines separating them from everyone else.
The Hardware Behind the Work
The hardware behind high performers looks less like a single premium laptop and more like a rotating set of screens.
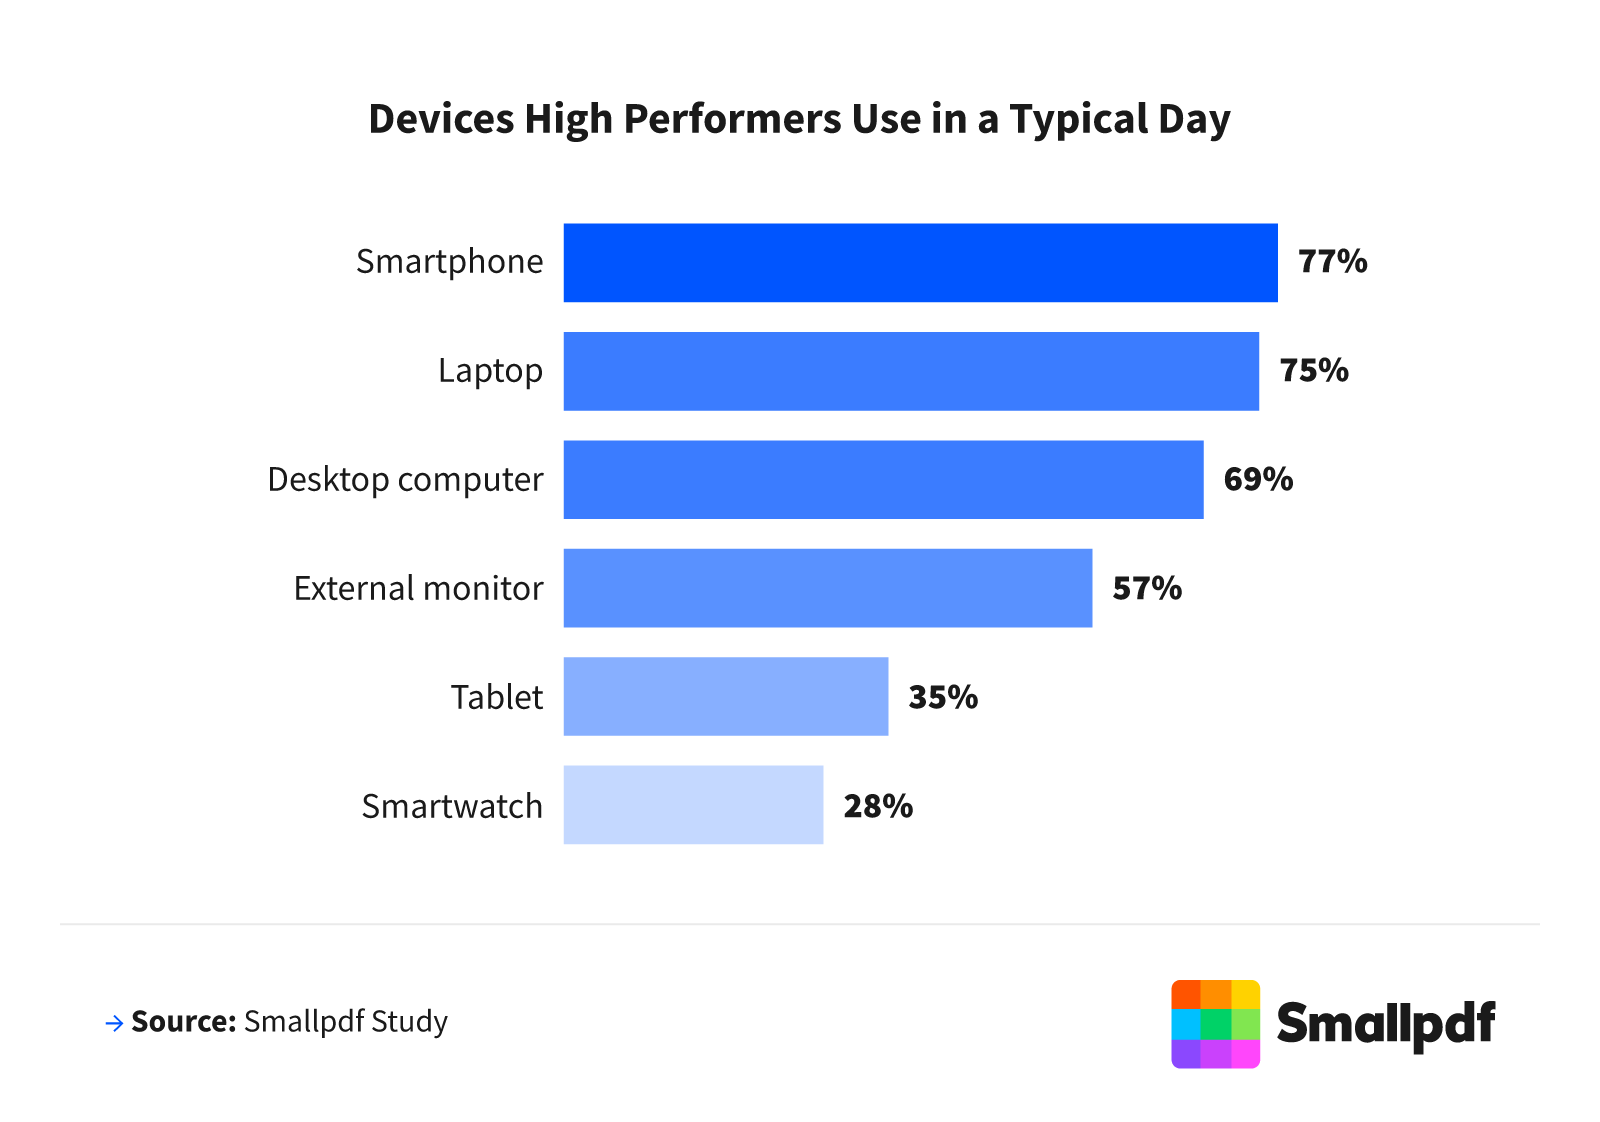
Among high performers, 77% work on a phone, just ahead of laptops (75%) and desktops (69%). On average, they move across 3.4 devices per day, compared with 2.9 for everyone else, and 63% run 3 or more devices, while 41% run 4 or more.
More than half (57%) said they run a second monitor daily. They also used tablets (35%) and even smartwatches (28%) for work purposes.
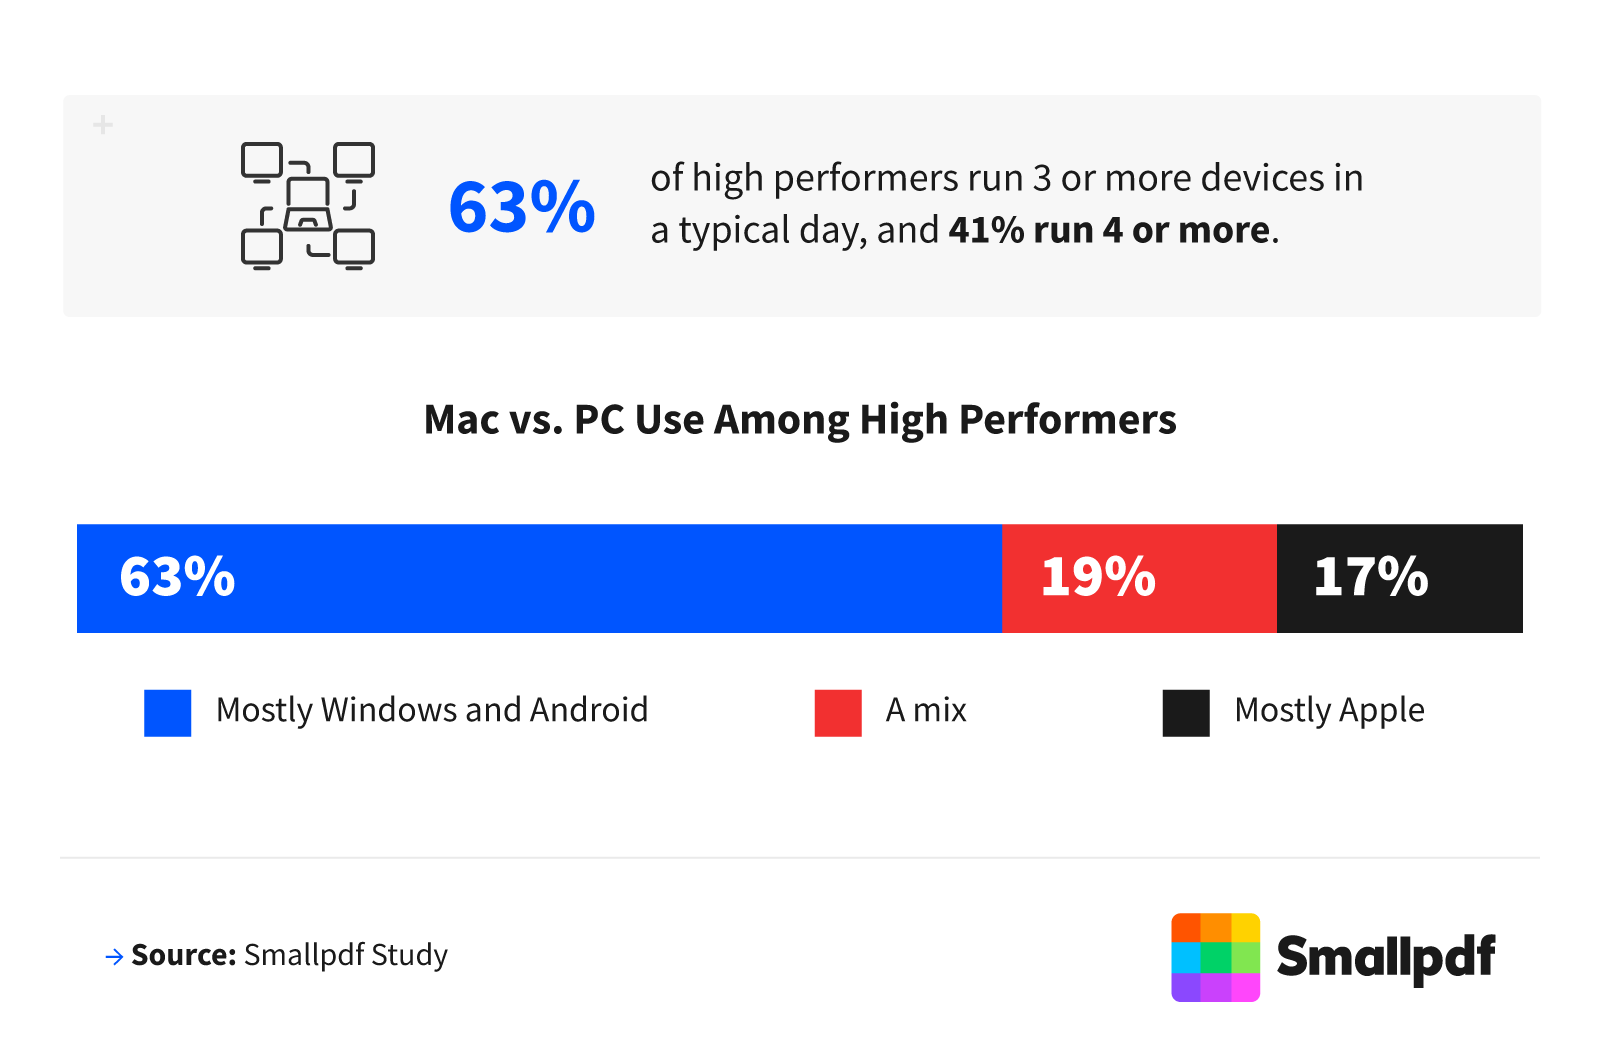
The idea that top performers all work on Macs doesn't hold up. Only 17% ran mostly Apple hardware, while 63% ran mostly Windows and Android, and 19% mixed the two. As for backup files, 21% of high performers reported keeping files on an external hard drive, and 17% keep printed copies.
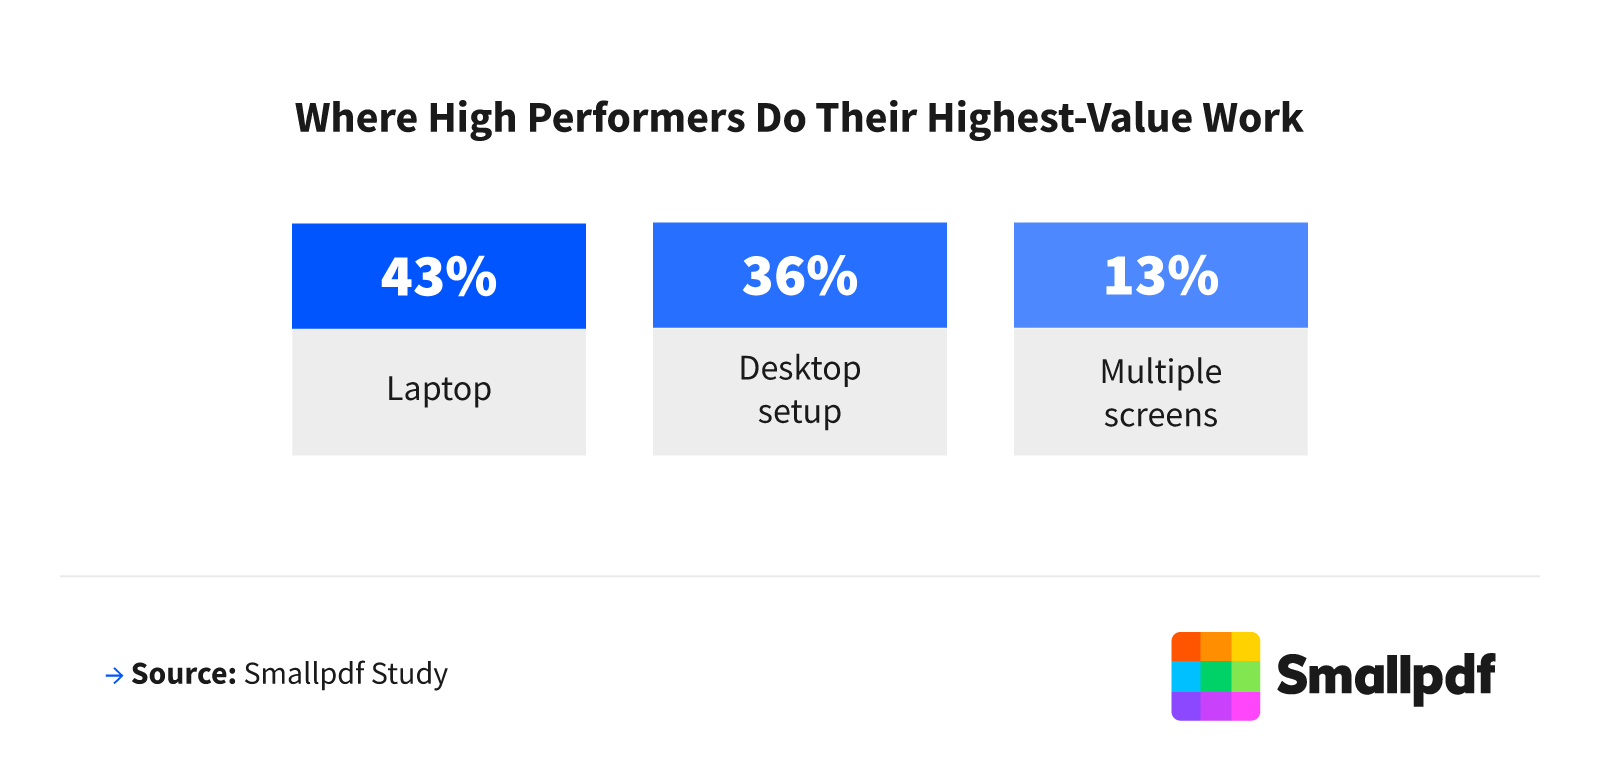
For their most important work, high performers still gravitated to a bigger screen: 43% did their highest-value work on a laptop, 36% on a desktop setup, and 13% across multiple screens.
Neat Isn't the Same as Organized
Most people keep a tidy setup, so tidiness barely separates high performers from the rest. The advantage goes to those who can actually retrieve their work, not those with the cleanest desktop.
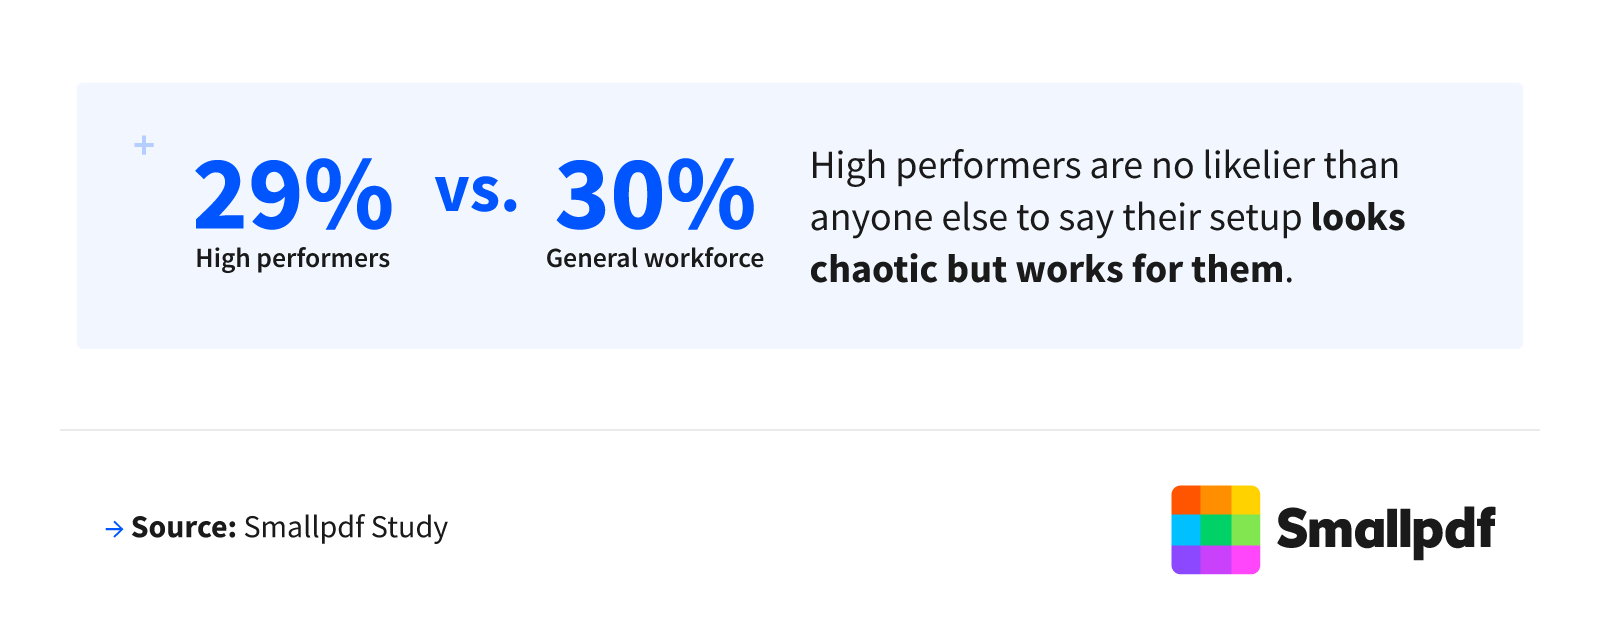
High performers were no tidier than anyone else in the ways you might expect. Twenty-nine percent said their setup looks chaotic but works for them, almost identical to the 30% of everyone else, and 45% hit inbox zero, slightly below the 47% of the general workforce.
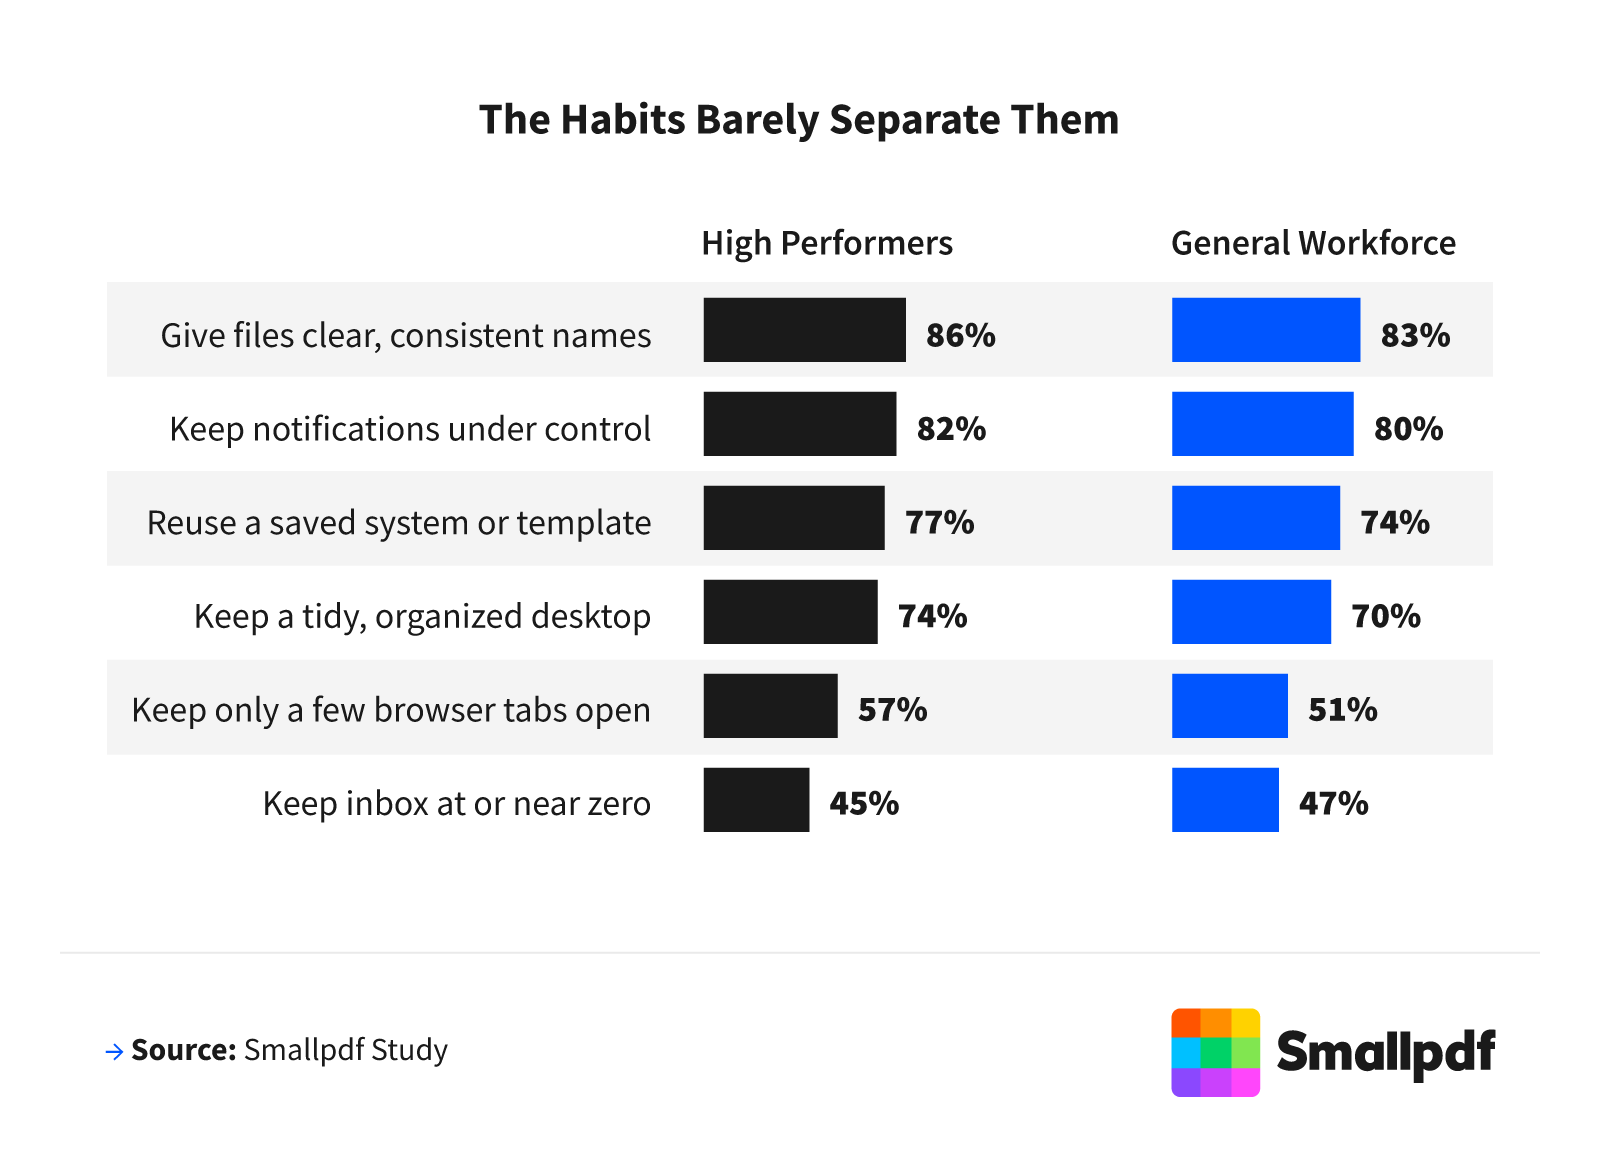
Good habits were nearly universal, not exclusive to the top. High performers edged ahead on:
Giving files clear, consistent names (86% vs. 83%)
Keeping notifications under control (82% vs. 80%)
Reusing a saved system or template (77% vs. 74%)
Keeping a tidy desktop (74% vs. 70%)
The clearer edge showed up in retrieval, where 26% could find a six-month-old document in under a minute, against 20% of everyone else.
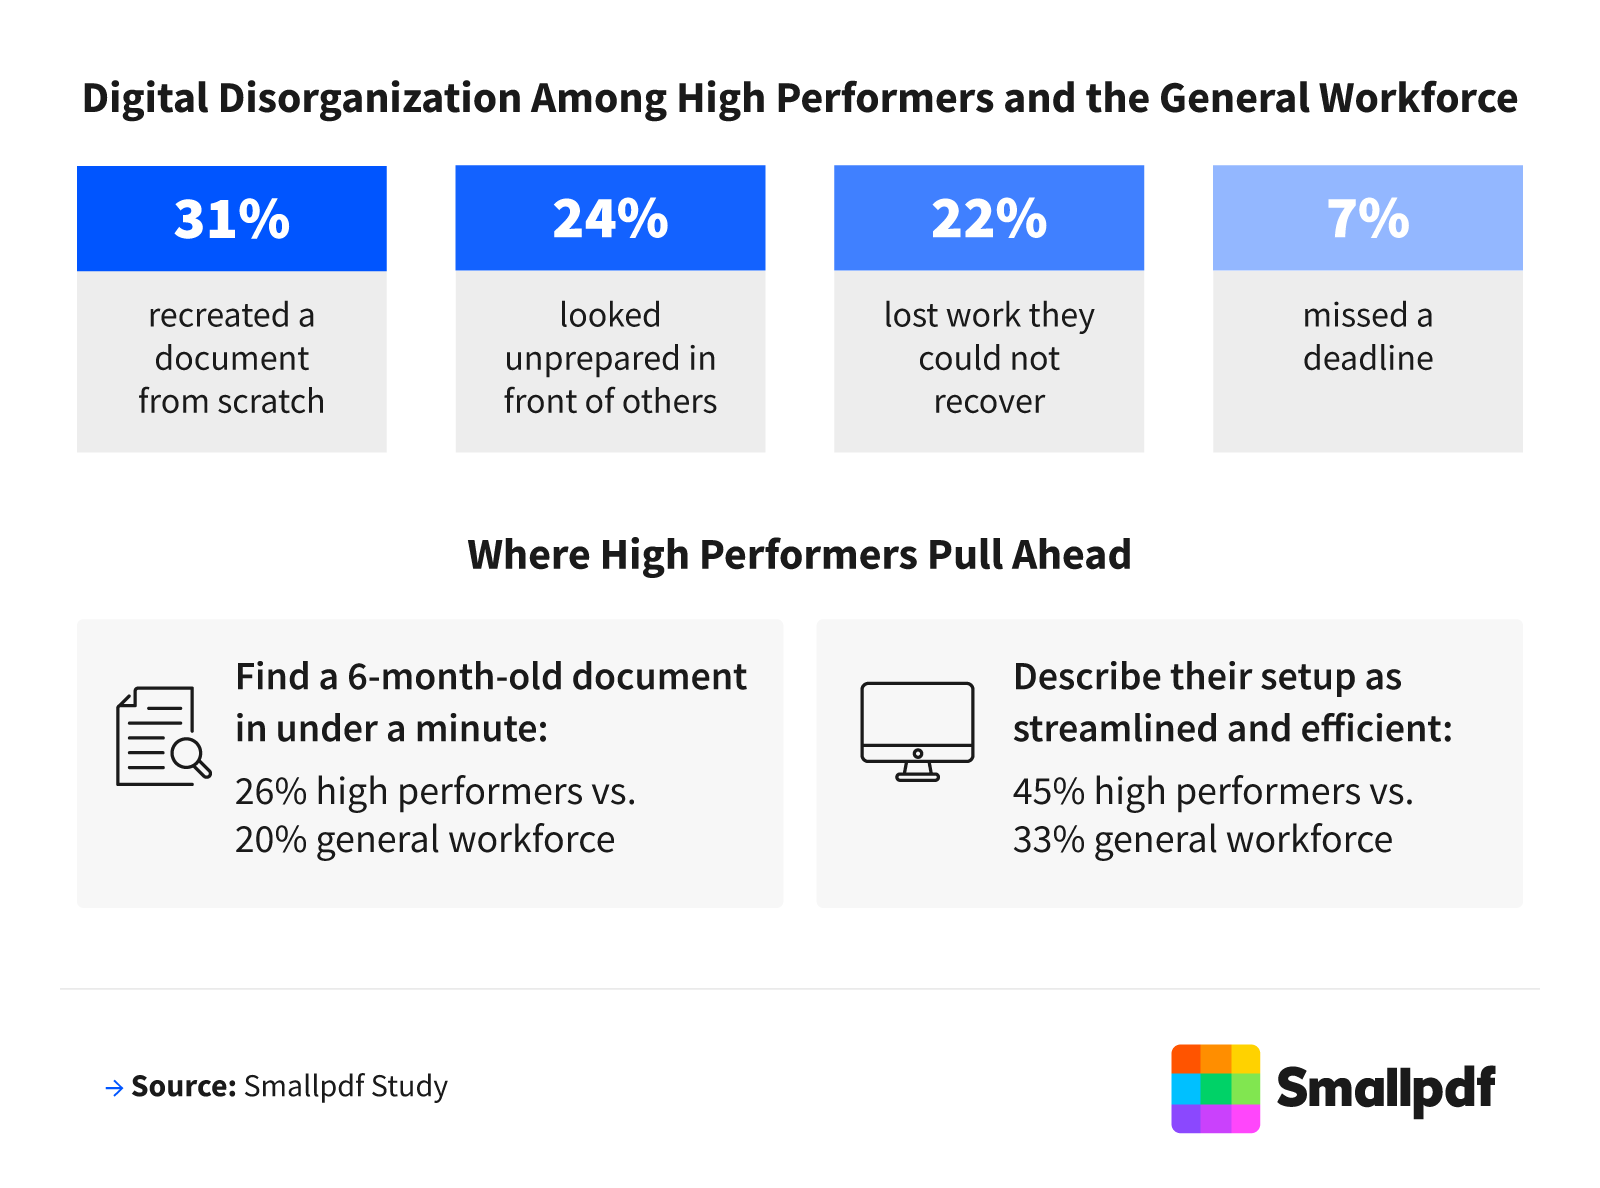
Disorganization still carried a price across the workforce. Thirty-one percent had recreated a document from scratch, 24% had looked unprepared in front of others, and 22% had lost work they couldn't recover. These were small, repeatable setbacks that trace back to messy files more than messy desks.
Streamliners vs. the "Good Enough" Majority
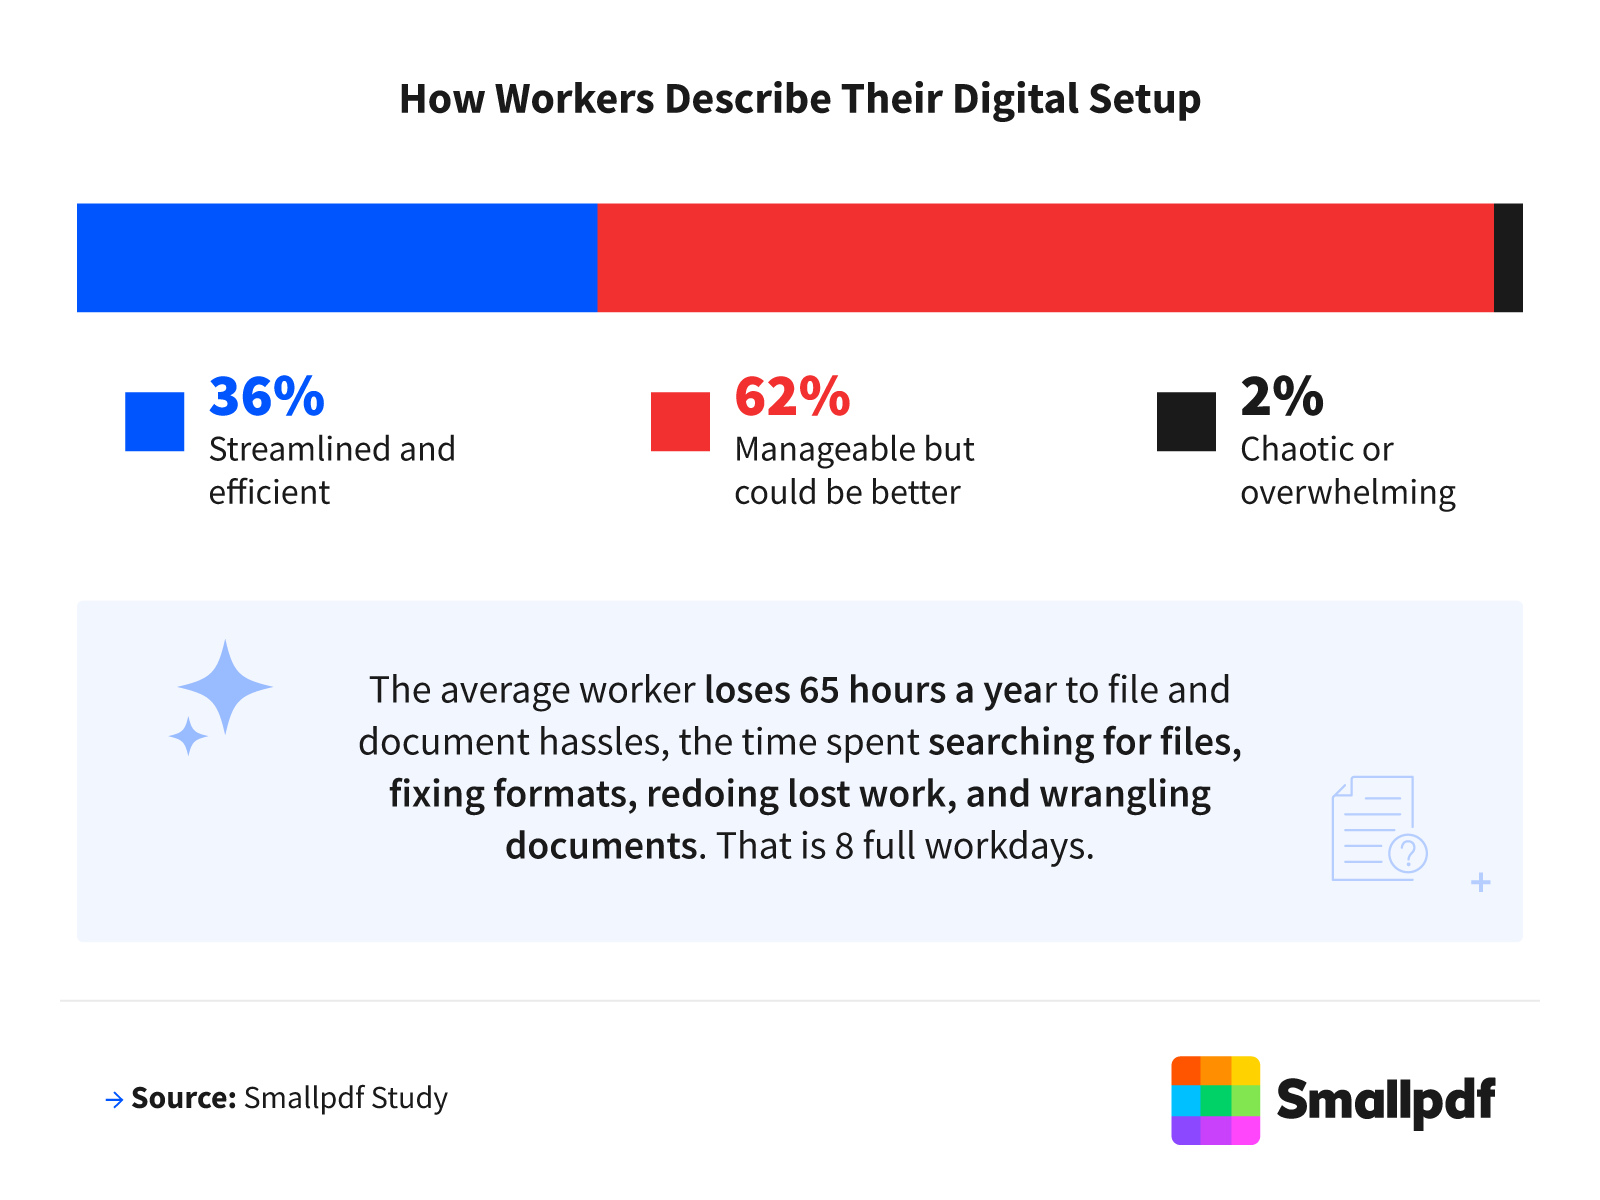
Only 36% of professionals called their digital setup streamlined and efficient. Most (62%) said it was manageable but could be better, and 2% called it chaotic or overwhelming. Among high performers, 45% said their setup was streamlined and efficient, while fewer of the general workforce (33%) said the same.
That in-between state has a real cost. The average worker lost 65 hours a year, about 8 full workdays, to file and document hassles like searching for files, fixing formats, and redoing lost work.
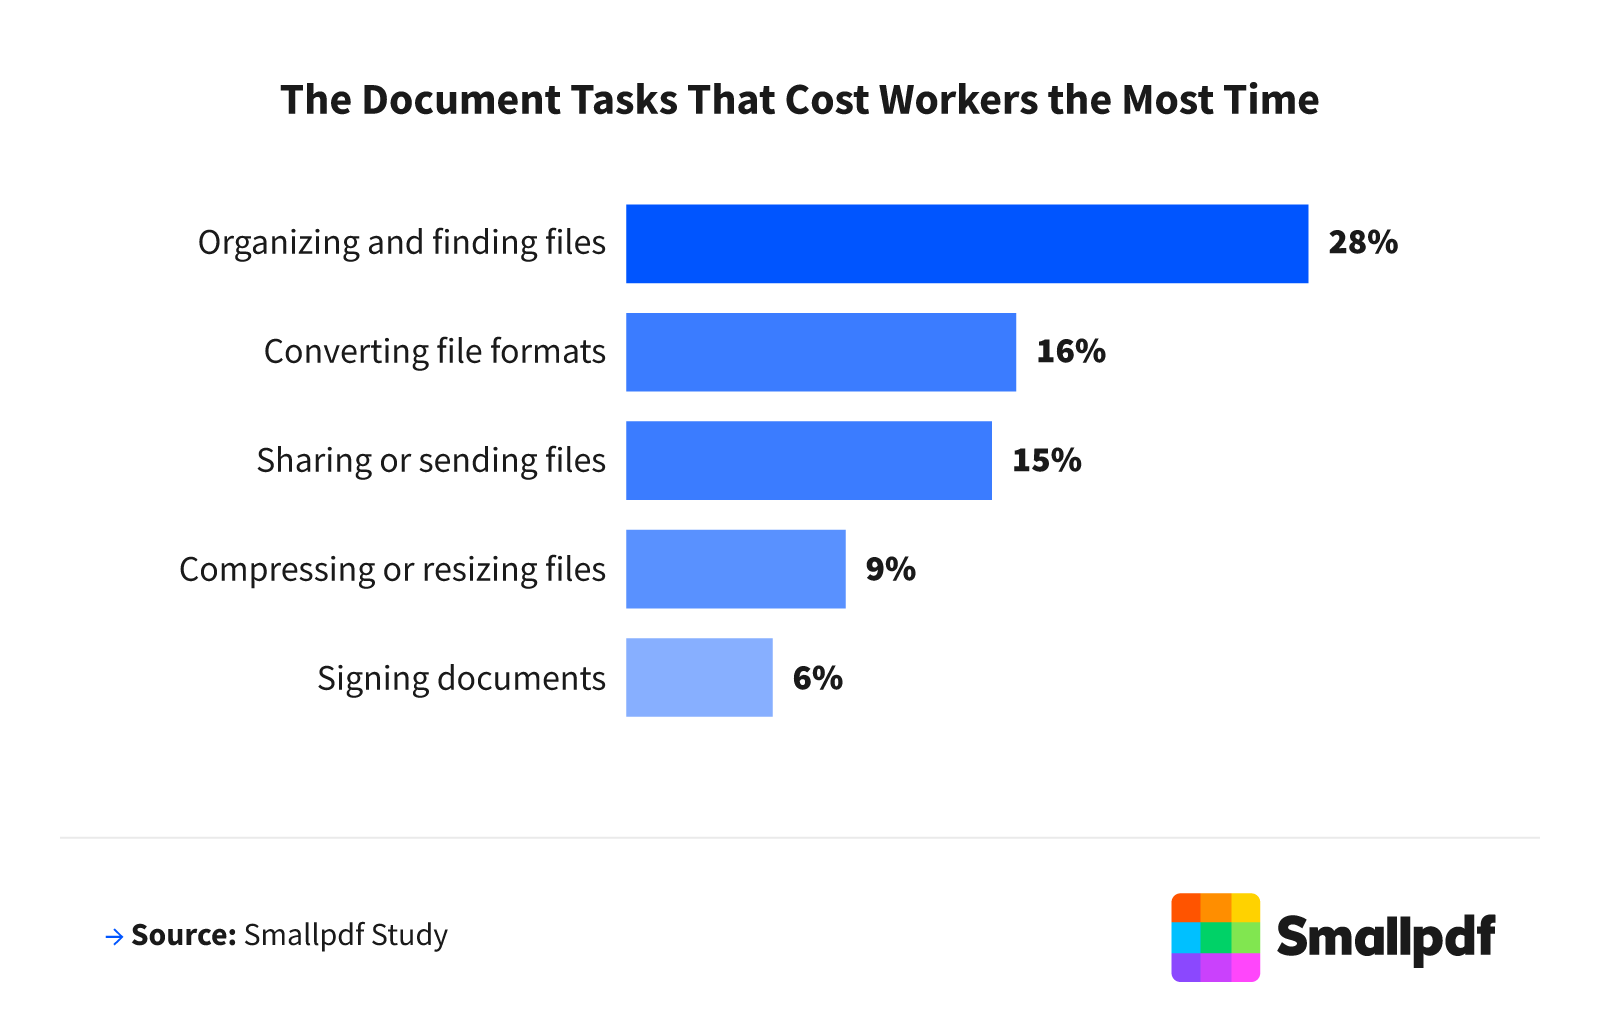
Organizing and finding files was the most time-consuming task (28%), followed by converting file formats (16%), sharing or sending files (15%), compressing or resizing files (9%), and signing documents (6%). These were small, repeatable steps rather than big projects, and they wasted time on a workday.
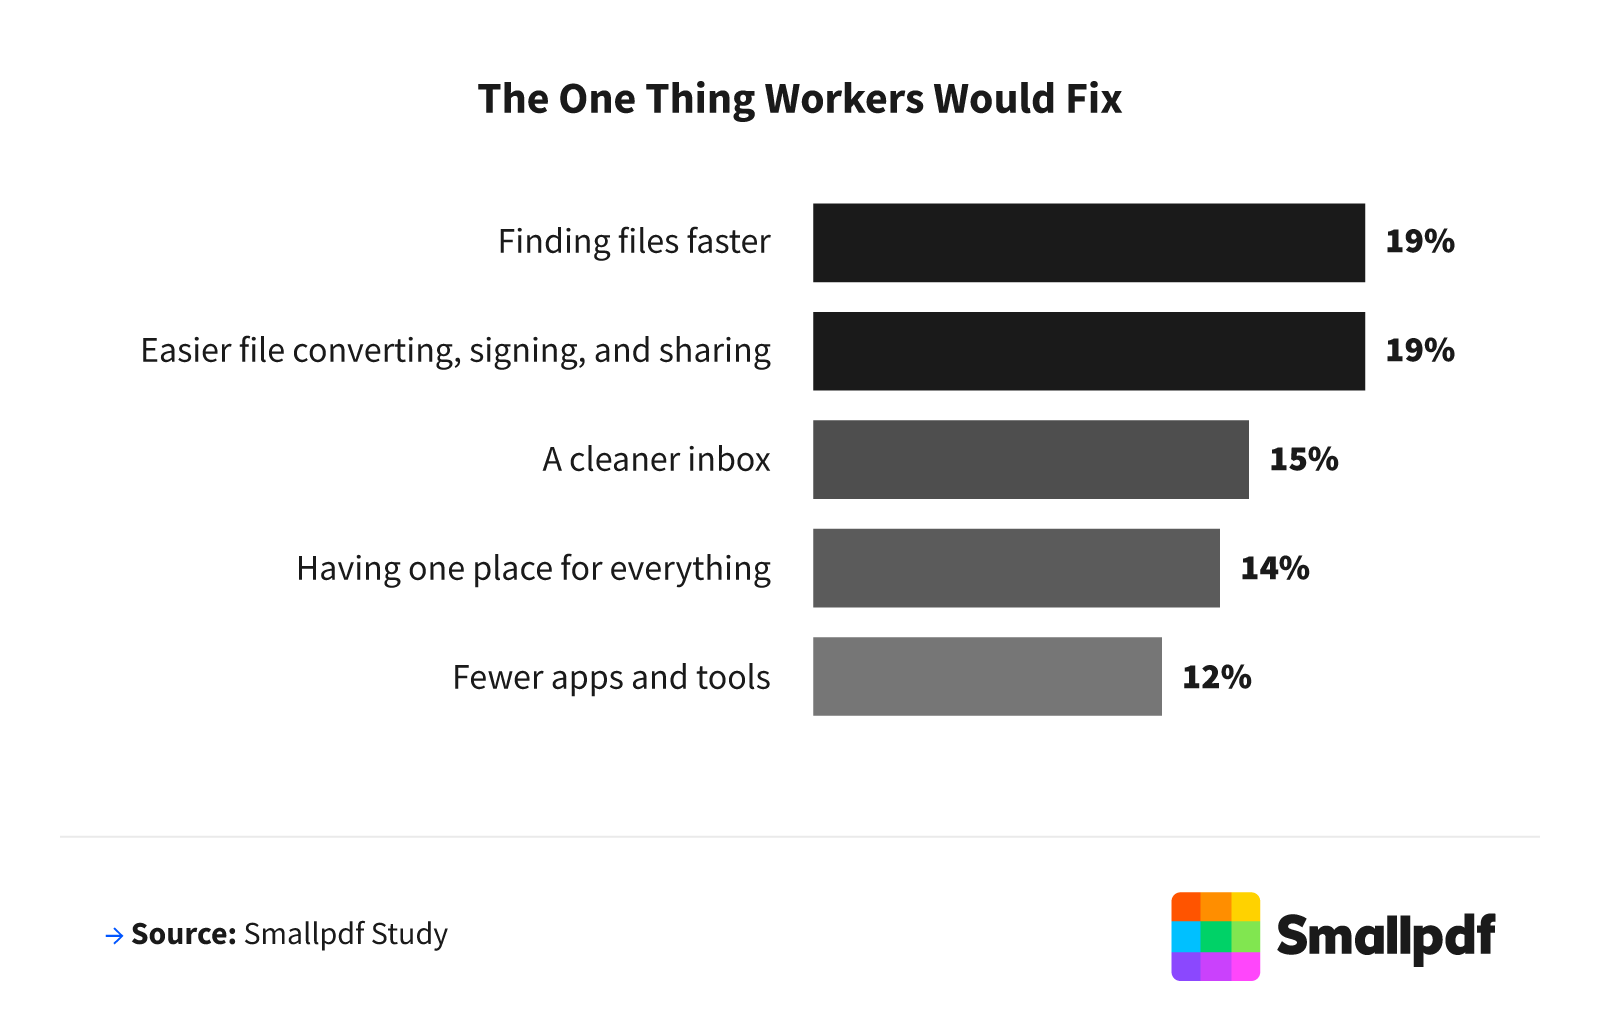
Asked what one change would help most, workers were split between finding files faster and easier converting, signing, and sharing, at 19% each. High performers were clearer about it, naming easier converting, signing, and sharing as their single most wanted fix at 22%. Turning a scanned contract into an editable file with a tool like PDF to Word is exactly the kind of small win that adds up.
What the Best Screen Stacks Have in Common
High performers didn't pull ahead on better gadgets or tidier desktops. What set them apart was fewer walls between themselves and their work, from a few trusted devices to AI used without handing over the wheel, and less time wrestling with files.
If you want to close the gap, start where the hours actually go: make files easy to find, convert, and sign, and treat a cluttered workflow as the problem worth fixing. AI can shave minutes off a task, but the steadier win is removing the friction that costs the average worker several workdays a year.
Methodology
This study is based on first-hand research, an original Smallpdf survey of 1,011 working professionals fielded through CloudResearch Connect and Prolific. After deduplicating on respondent ID, all 1,011 complete responses were retained for analysis.
High performers were defined before analysis using a fixed three-part composite. A respondent qualified only if they met all three criteria: they held a manager, senior leader, or executive role; they received a promotion or significant raise in the past two years; and they rated their own job performance as above average or in the top 10%. This yielded 248 high performers (25% of the sample), compared against the remaining 763 respondents, who form the general workforce.
Age was grouped into generations as Gen Z (18 to 29), millennials (30 to 45), Gen X (46 to 61), and baby boomers (62 and older). For numeric questions, such as tools used and hours lost per week, averages are reported after removing outliers using the interquartile range method, with a single global fence applied for comparability. Annual friction figures extrapolate weekly hours across 52 weeks, converted to workdays at eight hours each. Demographic breakdowns are reported only for subgroups representing at least 5% of respondents. Percentages not totaling 100% are due to rounding or multiple-select questions.
Because job performance is self-reported and success is partly self-defined, all findings are framed as correlation rather than causation. High performers tended to work with less digital friction and more capable tools, but the study does not claim these habits cause success.
About Smallpdf
Smallpdf is an easy-to-use online platform that helps people convert, compress, edit, merge, split, and sign PDFs in a few clicks. Built for professionals who would rather remove friction than manage more software, Smallpdf turns the everyday document tasks that cost workers the most time into quick, reliable steps.
Fair Use Statement
You are welcome to share the findings and visuals from this study for noncommercial purposes. Please link back to this page so readers can view the full research and the authors receive proper credit.